For years, many SEO teams treated organic CTR as if it behaved like a single, stable curve. One benchmark could stand in for the rest. One forecast could cover every device. One reporting view could blend desktop and mobile into a neat average.
That assumption is getting harder to defend.
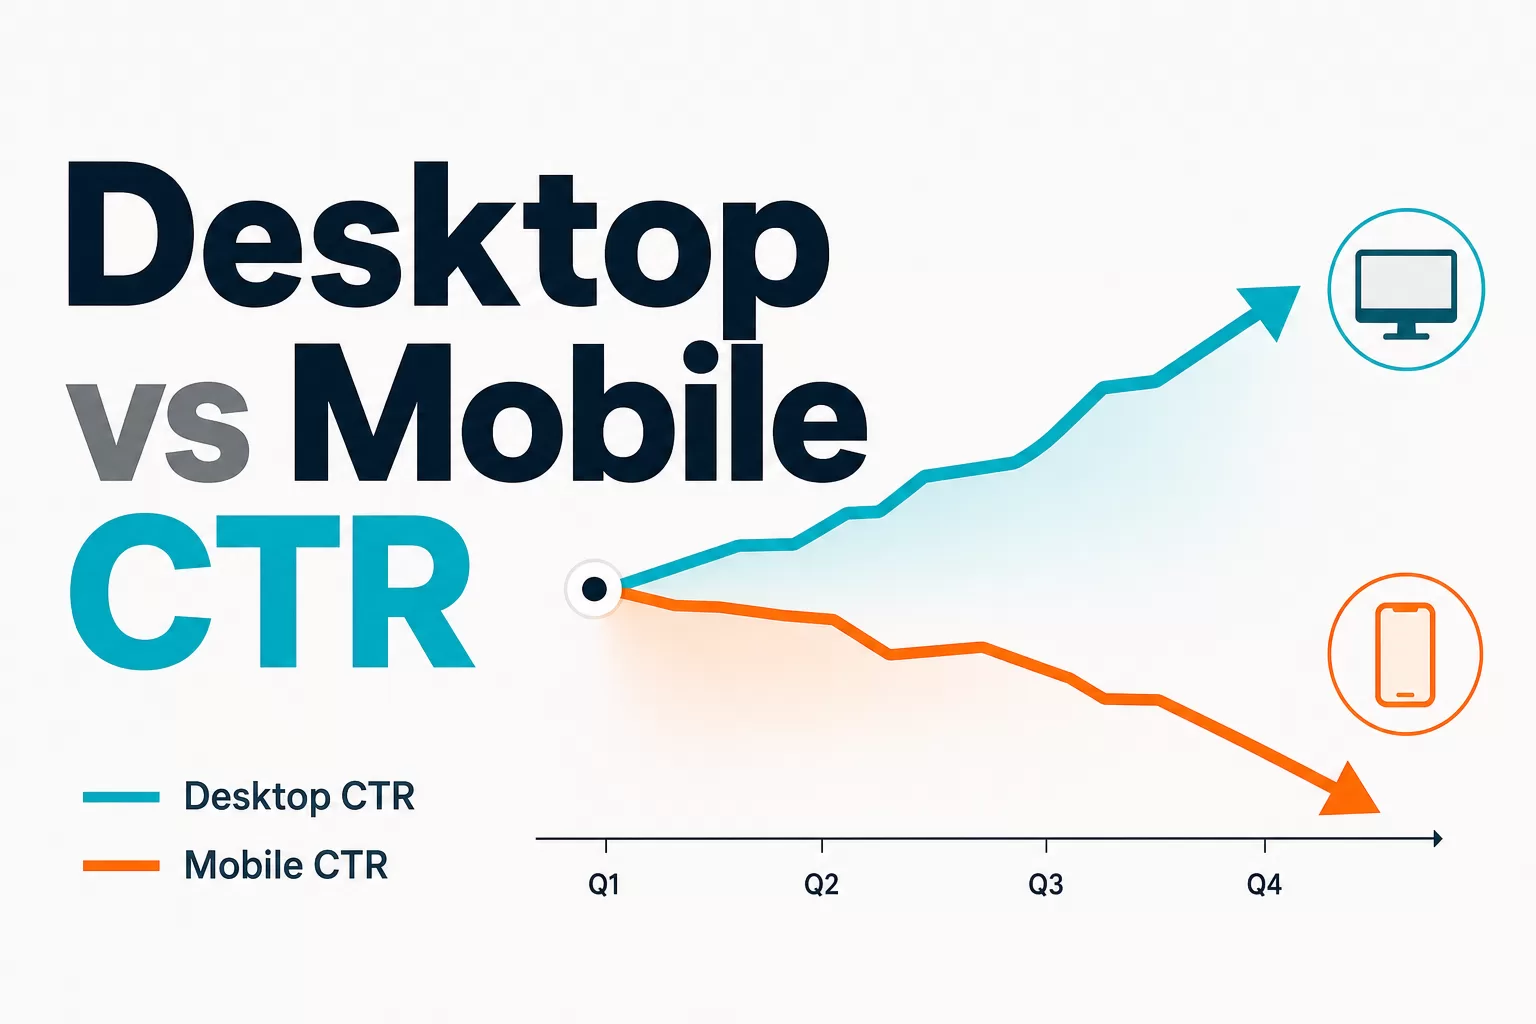
Recent benchmark movement suggests that desktop CTR and mobile CTR are no longer moving in lockstep. Desktop results rose across the quarter in the dataset, while mobile softened, with the sharpest pressure appearing at position one. That does not prove a Google algorithm change. It does, however, show that device-level behavior now matters more than blended averages.
Key takeaway: if your reporting still uses a single CTR curve for both devices, your forecasts can be wrong in both directions — overstating mobile traffic and understating desktop traffic.
This matters for SERP analysis, traffic modeling, and executive reporting. It also changes how we interpret ranking gains when the top result is competing with AI Overviews, ads, featured snippets, and other modules that behave differently on desktop and mobile.
What the latest CTR data shows
For hands-on help with this topic, explore Keyword Research & Analysis.
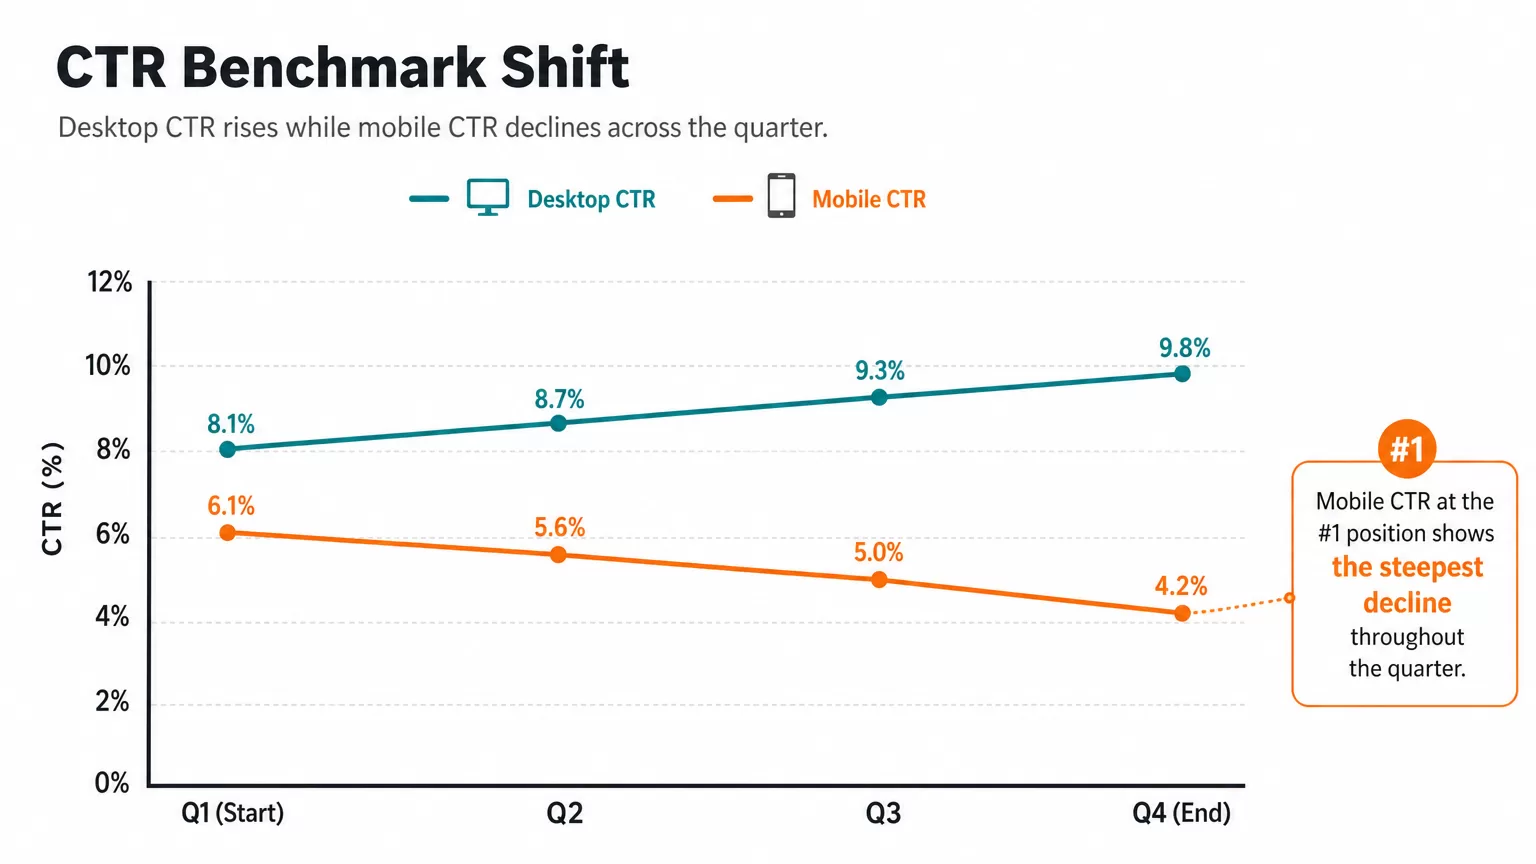
The clearest signal in the benchmark data is simple: desktop organic CTR improved while mobile CTR weakened. The split was visible across the quarter and was most pronounced at the #1 position, which is still the most valuable organic placement in most markets.
That top-position movement matters because position one usually captures the largest share of clicks and is the most exposed to changes above the fold. When a SERP feature expands, shifts, or changes the visual balance of the page, the impact is rarely uniform across devices.
- Desktop CTR rose across the observed period.
- Mobile CTR declined, especially at position one.
- The split appeared in both branded and unbranded queries, which makes it more meaningful than a narrow anomaly.
- Changes were position-specific, not evenly distributed across the top ten.
That last point is important. Broad averages can hide what is happening at the positions that actually drive traffic. A top-ten lift may look healthy in aggregate while the #1 result is losing clicks and positions 2 through 10 are flat.
For teams that rely on Measure Search Performance Beyond Rankings, this is a reminder that ranking alone is no longer enough. The click curve is part of the story, and the curve is now device-sensitive.
Do not treat this as proof of a universal Google shift. The dataset reflects observed benchmark movement, not a direct statement about ranking-system changes.
Why desktop and mobile are diverging
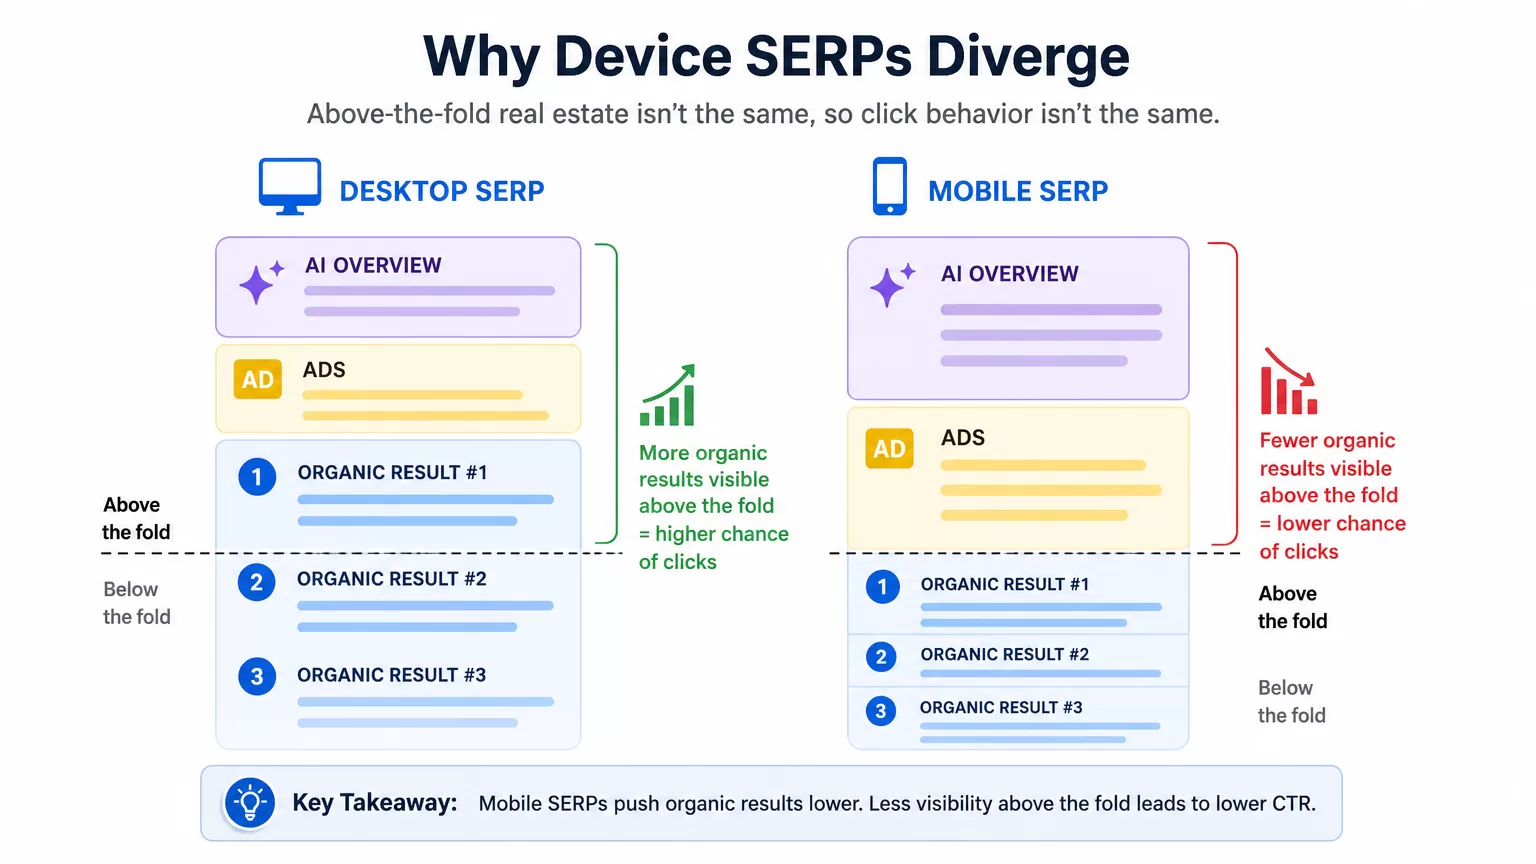
The most practical explanation is also the least dramatic: desktop and mobile SERPs are not the same experience. They may show the same query, but the layout, spacing, and above-the-fold competition differ enough to change user behavior.
On desktop, users often have more screen space, more visible organic results, and a different scanning pattern. On mobile, the first result may be pushed lower by ads, AI Overviews, product modules, or other interface elements. That means the same ranking can produce different click outcomes depending on device.
Several factors likely contribute to the split:
- SERP composition: AI Overviews, featured snippets, shopping modules, and ads can crowd out organic visibility differently on each device.
- Interface constraints: mobile screens compress the first view, making top-of-page modules more influential.
- User intent and behavior: desktop searchers may be more willing to compare, open multiple tabs, or click deeper into organic listings.
- Query context: some searches naturally lend themselves to faster mobile answers, reducing the incentive to click.
The important nuance is that this is not a single-cause story. AI Overviews are relevant, but they are only one part of a broader SERP ecology. Ads, snippets, and layout changes all influence the click path.
For SERP analysis, that means device context is no longer optional. If you review only blended CTR, you may miss that a desktop ranking is holding steady while mobile is eroding, or vice versa.
Branded vs unbranded differences
The split is visible in both branded and unbranded queries, but the size of the movement differs. That distinction matters because branded and unbranded searches represent different stages of demand.
Branded queries usually indicate known demand. Users already recognize the entity, product, or publisher they are searching for. In the benchmark data, branded desktop searches saw the strongest gains overall, with increases across top-ten positions. Mobile branded movement was smaller, which suggests that even familiar intent does not eliminate device effects.
Unbranded queries are often more valuable for discovery and new-user acquisition. Here, the mobile decline at #1 is especially important. If the top result on mobile is losing clicks on non-branded searches, that can affect:
- new customer acquisition
- top-of-funnel content performance
- forecasted traffic from informational pages
- the perceived value of ranking improvements
One useful way to interpret this is to separate the click curve into four layers: desktop branded, desktop unbranded, mobile branded, and mobile unbranded. That structure is much closer to reality than a single blended benchmark.
Blended CTR can mask opposite truths. A page may be outperforming on desktop while underperforming on mobile, and the average will hide both signals.
That is why device-aware segmentation should be part of every serious SEO reporting workflow, especially when rankings are being used to justify content investment or traffic forecasts.
Industry-level outliers
The broad split is meaningful, but the outliers are what make the story actionable. Across 22 industry categories, some sectors saw much stronger movement than others, which reinforces a key point: CTR is shaped by context, not just position.
On the positive side, one of the strongest desktop gains in the dataset appeared in Family & Parenting, where first-ranked sites saw a notable increase. On the negative side, Law, Government, & Politics showed a steep mobile decline at position one.
Those outliers tell us two things:
- Industry SERPs behave differently. The same device split may be amplified or muted depending on query type and SERP features.
- Position one is not equally protected everywhere. In some verticals, the top result still commands strong attention; in others, it is being squeezed by richer SERP elements.
This is also where the broader CTR conversation becomes relevant. Other studies have shown sharp pressure on top-position clicks when AI Overviews appear, including major drops in position-one CTR. But it would be a mistake to assume every industry is affected identically or that one feature explains every movement.
Practical implication: benchmark against your own vertical first, then compare device splits inside that vertical. A generic industry average is often too blunt to guide forecasting.
What SEOs should change in reporting
If desktop and mobile CTR are diverging, reporting has to change with them. The goal is not just cleaner dashboards. It is better decision-making.
At a minimum, teams should update reporting to include:
- separate desktop CTR and mobile CTR curves
- branded vs unbranded segmentation
- position-level reporting instead of only top-ten totals
- SERP feature context such as AI Overviews, featured snippets, and ads
- query-level or page-level notes for major outliers
This matters because blended reporting can create false confidence. If mobile weakens and desktop strengthens, the average may look stable enough to ignore. But stable averages can conceal meaningful traffic shifts.
Teams should also be careful not to overread aggregate gains. A top-ten improvement can be real while the first position is losing share. If your content strategy prioritizes high-intent pages, that distinction affects how you evaluate wins.
For broader measurement context, it helps to connect CTR reporting to The Complete Guide to SEO in 2026: Strategy, Technical Foundations, and Measurement. The more search becomes a mixed environment of organic results, AI responses, and rich features, the more reporting needs to reflect that complexity.
New reporting rule: never let a blended benchmark answer a device-specific question.
Forecasting traffic in a changing SERP
This is where the split becomes operational. Forecasting traffic from impressions using a single CTR curve is increasingly unreliable. The old model assumed that if rankings moved, clicks would follow in a predictable way. That assumption is weaker now.
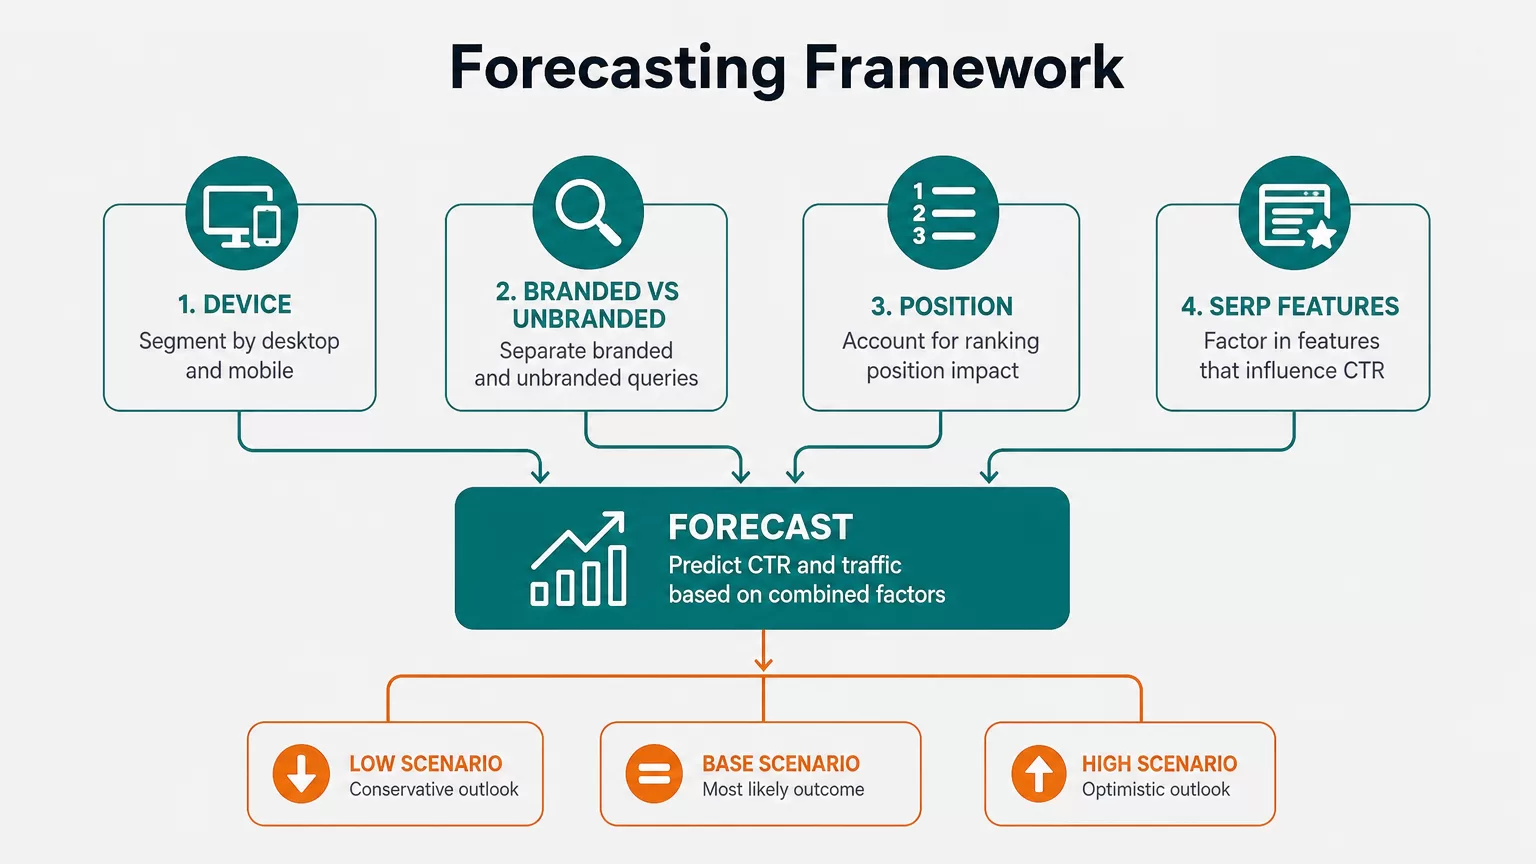
A better forecasting model separates the variables that actually influence click behavior:
- device — desktop versus mobile
- query type — branded versus unbranded
- position — especially position one
- SERP features — AI Overviews, ads, featured snippets, shopping modules
- intent class — informational, navigational, transactional, local
From there, teams can build more realistic traffic ranges rather than a single-point estimate. For example, a page ranking first on mobile for an unbranded query with an AI Overview above it should not be forecast with the same CTR curve as a branded desktop query with a cleaner organic layout.
That may sound obvious, but many forecasting models still rely on historical blended averages. Those averages are now more likely to overstate mobile traffic and understate desktop traffic, especially when the SERP layout differs by device.
Here is a practical way to update the workflow:
- Pull Search Console data by device.
- Separate branded and unbranded queries.
- Map CTR by exact position.
- Annotate SERPs with visible features.
- Use scenario-based forecasts instead of one universal curve.
The broader lesson is straightforward: CTR is dynamic, not fixed. It changes with device, intent, and the shape of the result page. Forecasts that ignore those variables will drift away from reality.
That is especially true in a search environment where AI Overviews and other modules can alter the click path without changing the ranking position itself. The ranking may stay the same while the traffic outcome changes materially.
Forecasting should model the SERP, not just the rank.
For SEO teams, that shift is uncomfortable but necessary. The more accurately you model device-level behavior, the better you can defend content budgets, set expectations, and prioritize pages that still have room to win clicks.
In other words, the question is no longer, “What is the average CTR for position one?” The better question is, “What is the CTR for this device, this query type, and this SERP?”
That is the standard SEOs should adopt now.