Google Discover headline analysis is one of those topics that looks simple until the data gets large enough to expose the cracks. At the pooled level, some headline formats appear to win convincingly. Quote-led headlines may seem stronger than statements. Questions may look better than expected. But once you segment by publisher, the story changes fast.
That is the core problem: headline format is rarely the whole explanation. In Discover, what looks like a headline effect is often a blend of publisher identity, audience expectations, topic selection, and surface-specific behavior. If you only look at aggregate averages, you can end up optimizing for a statistical mirage.
Key takeaway: In Google Discover, headline format can matter, but aggregate data often overstates its power. The real signal emerges only after publisher-level segmentation.
For editors and SEOs, that means headline optimization should move beyond template advice and into measurement discipline. The question is not simply, “Should we use quotes or questions?” The better question is, “For which publisher, content type, and audience segment does this format actually change visibility?”
Why aggregate headline data misleads
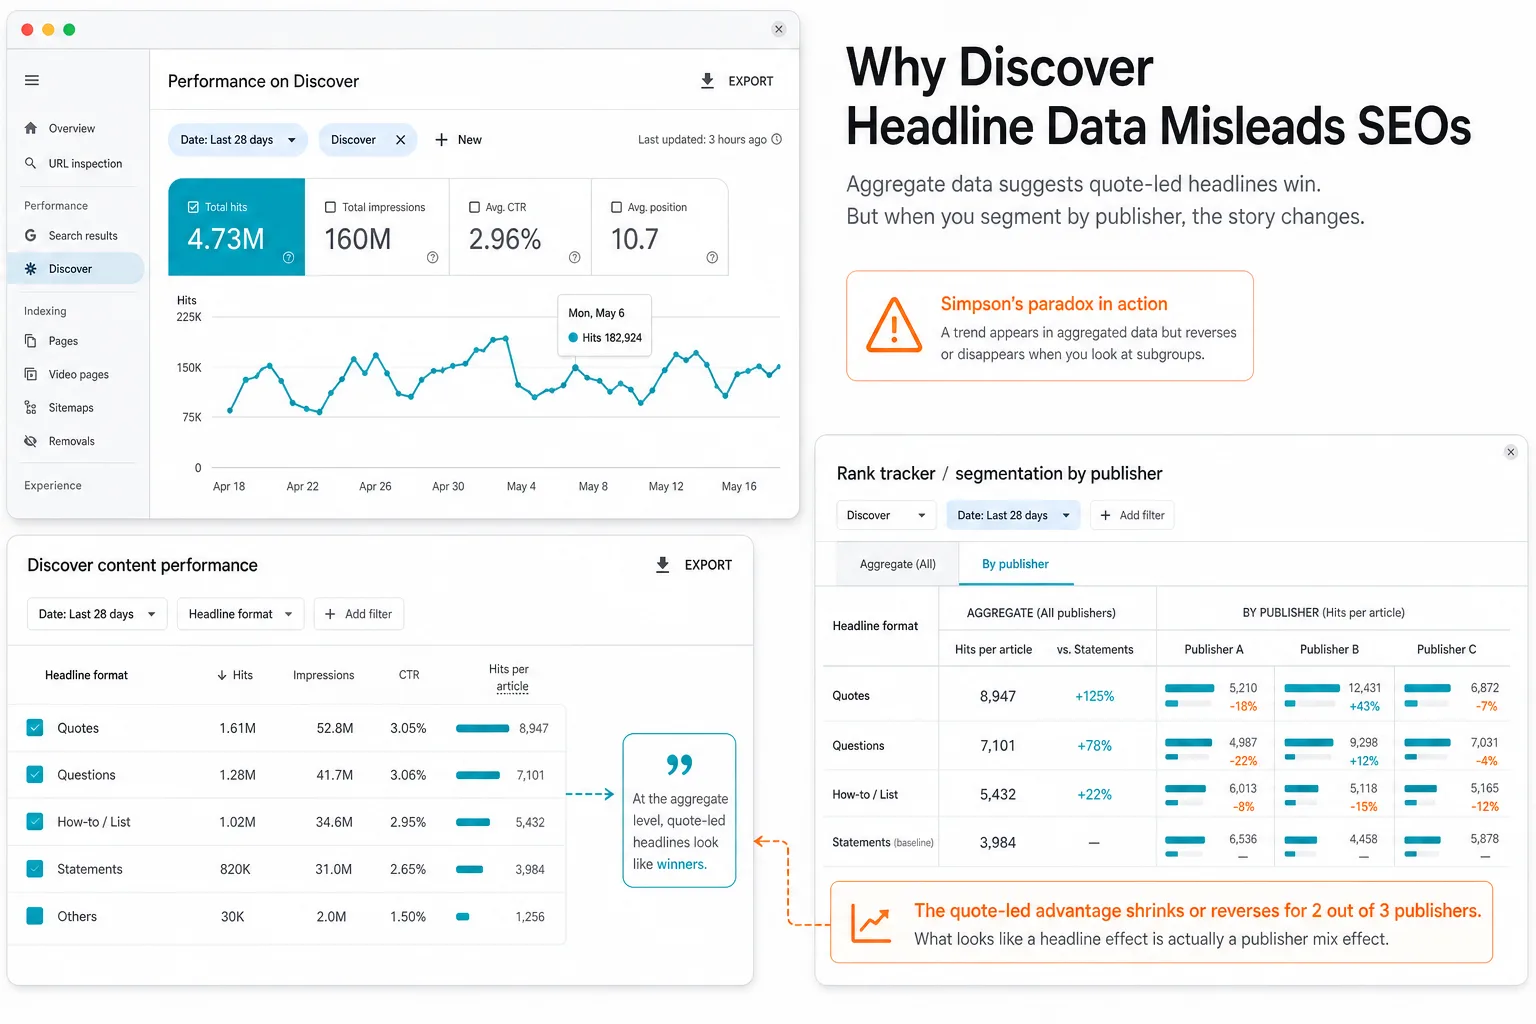
Aggregate headline data is seductive because it gives you a clear answer. Pool millions of articles together, compare format groups, and a pattern appears. Quote-led headlines may outperform statements. Questions may outperform statements too. It feels actionable.
But aggregation hides important differences between publishers. A site that regularly publishes personality-driven, conversational, or interview-based stories will naturally use more quote-led headlines. A wire-style publisher may rely on declarative headlines. If the first group also earns more Discover visibility overall, the format gets credit for what is partly a publisher-level advantage.
This is where Simpson’s paradox becomes essential. A trend that appears in the whole dataset can shrink, weaken, or reverse when the data is segmented. In other words, the pooled result may be true mathematically and still be misleading analytically.
Warning: Big sample size does not fix bad grouping. A million articles can still produce the wrong conclusion if the comparison buckets mix different publisher ecosystems.
That matters especially in Discover because we are not measuring a clean, isolated click experiment. We are observing visibility behavior across a complex surface where editorial brand, topical fit, and historical performance all influence whether an article gets surfaced in the first place.
If you want a broader framework for this kind of search analysis, it helps to think in terms of measurement systems rather than headline tricks. Our The Complete Guide to SEO in 2026: Strategy, Technical Foundations, and Measurement covers the larger technical and analytical mindset that makes this kind of evaluation more reliable.
What the 3.4M-article corpus reveals
The value of a large corpus is not just scale for its own sake. It is that scale makes segmentation possible without collapsing into tiny, noisy subgroups. In this case, the dataset spans roughly 3.4 million editorial articles across English and French, which is large enough to compare headline formats within publishers rather than only across the entire pool.
That distinction matters because the metric used here is not direct Discover clicks. Third-party systems cannot access Discover click data directly, so the analysis uses hits per article as a visibility proxy. That tells us how often an article appears across the observed Discover fleet, not how often users click it once it is shown.
That limitation is important, but it does not make the analysis useless. It simply means the findings should be interpreted as visibility frequency, not downstream engagement.
At the pooled level, the pattern looks strong:
- English quote-led headlines show a noticeably higher mean hit rate than statement headlines.
- English question headlines also outperform statements, which already challenges simplistic advice that questions are weak.
- French quote-led headlines show an even larger pooled advantage.
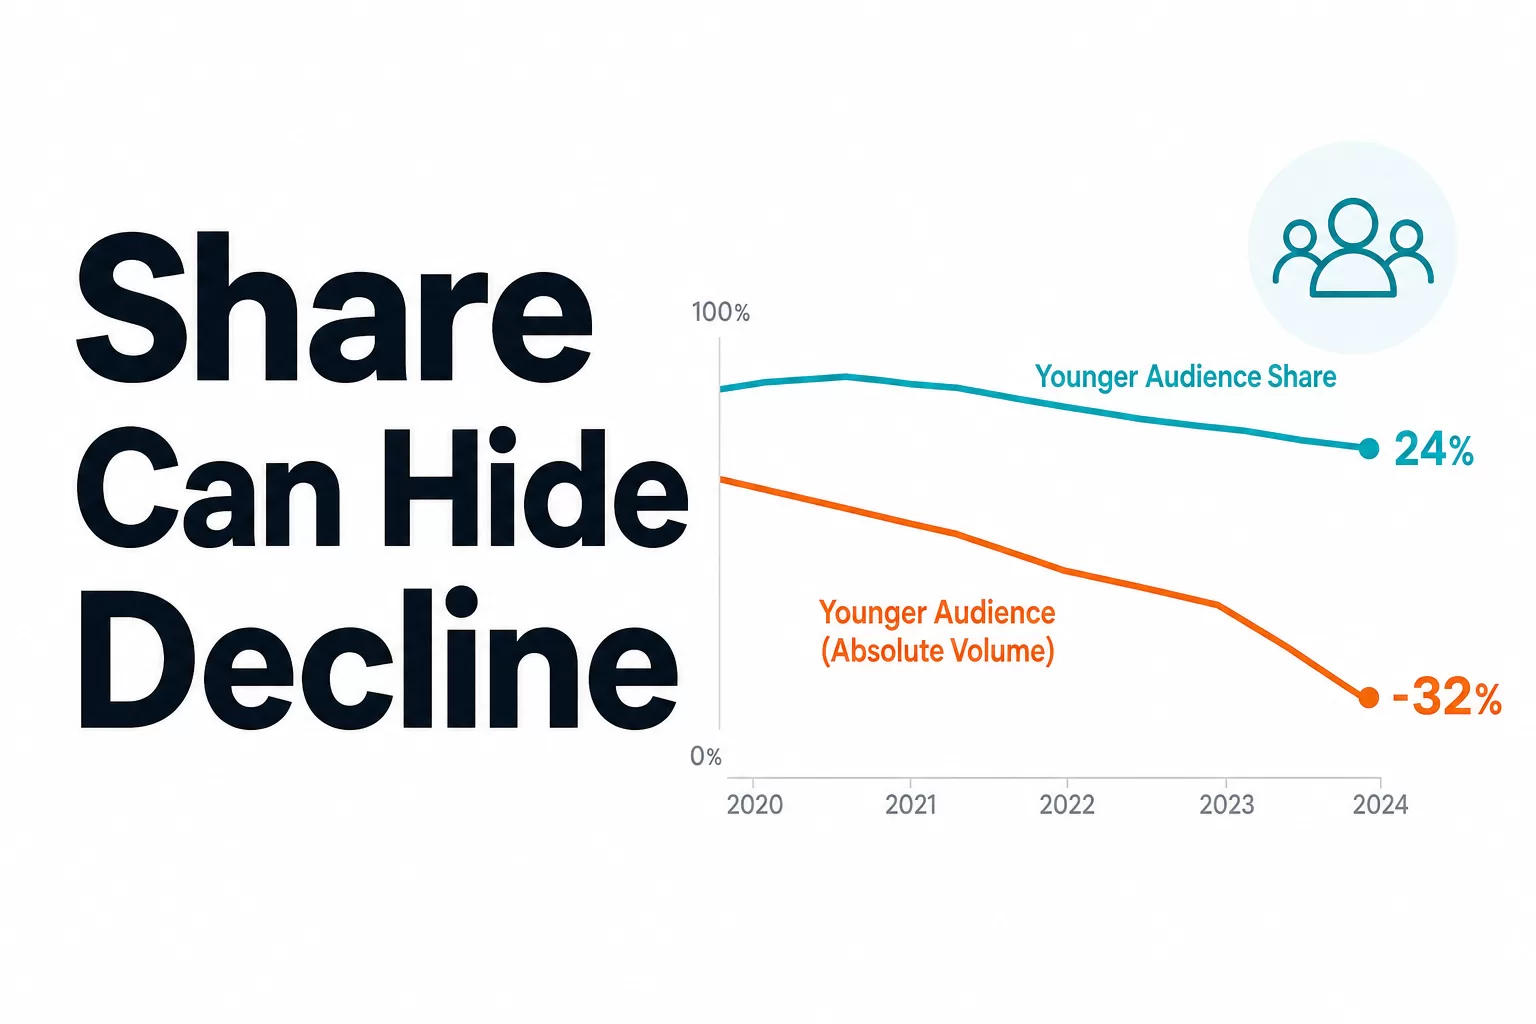
But the pooled effect is not the whole story. Once the analysis shifts to within-publisher comparisons, the headline-format lift shrinks sharply. In English, the within-publisher median lift for quote-led headlines is around +3.1%. In French, it is around +5.5%. That is far smaller than the aggregate effect and suggests that much of the apparent advantage comes from publisher mix rather than format alone.
Put differently, the headline format effect exists, but it is modest. It is roughly five to nine times smaller once publisher baselines are accounted for.
Interpretation: If a headline format only looks powerful when publishers are pooled together, the format may be acting as a marker of publisher type rather than a universal performance lever.
This is why headline advice based on pooled Discover data often sounds stronger than it really is. It may reflect the behavior of a subset of publishers with specific editorial models, not a general rule for the market.
Publisher-level effects vs format effects
The most useful way to understand Discover headline performance is to separate publisher effects from format effects. That means asking whether a headline style works because of the wording itself or because of the environment in which it appears.
Publisher-level effects include:
- Audience expectations — readers may respond differently to conversational vs. formal editorial brands.
- Topic mix — entertainment, news, and commentary sites naturally use different headline structures.
- Editorial voice — some publishers are built around quotation, personality, or reaction-led framing.
- Discover history — a publisher with strong visibility may amplify any format it uses more often.
Format effects, by contrast, are the incremental changes attributable to headline structure itself. Once you compare quote headlines against statement headlines within the same publisher, the signal becomes much smaller. That is the analytical move that matters.
In the English subset, the data shows that quote headlines win by the median for only a minority of publishers, while statement headlines outperform quotes at a large share of sites. That means the average “quote advantage” is not a stable universal law. It is an average built on uneven publisher behavior.
The same logic applies to question headlines. In pooled data, questions can look better than statements in both English and French. But that does not mean every editorial team should convert more headlines into questions. For some publishers, questions may fit the audience and topic mix. For others, they may dilute clarity or underperform within the site’s own baseline.
This is exactly why generic headline templates are dangerous. They encourage teams to copy surface patterns without understanding the underlying distribution of performance.
Practical rule: Do not compare your site’s headline formats to the market average unless you also control for publisher identity, section, and topic class.
For teams working in ranking, visibility, and content strategy, the lesson is consistent with broader search volatility work. Surface-level patterns can be real and still be misleading when interpreted too broadly. If you are tracking shifts in Discover or search visibility alongside broader ranking instability, our analysis of Google Ranking Volatility Keeps SEOs on Edge is a useful companion read.
Practical implications for editors and SEOs
The best response to this research is not to abandon headline testing. It is to test more intelligently.
Editors and SEOs should treat Discover headline analysis as a segmentation problem first and a copywriting problem second. That means building a process that isolates format from the many other variables that shape visibility.
Here is a practical framework:
- Compare within publisher, not across publishers. Use your own historical data as the primary benchmark.
- Segment by section and topic. News, politics, entertainment, and evergreen explainers often behave differently.
- Use visibility proxies carefully. Track hits per article, impressions, and Discover entry rate as separate metrics where possible.
- Watch for sample imbalance. A format may appear to win simply because it is used more often on stronger stories.
- Measure over enough volume. Small tests can produce false confidence, especially when a format is used selectively.
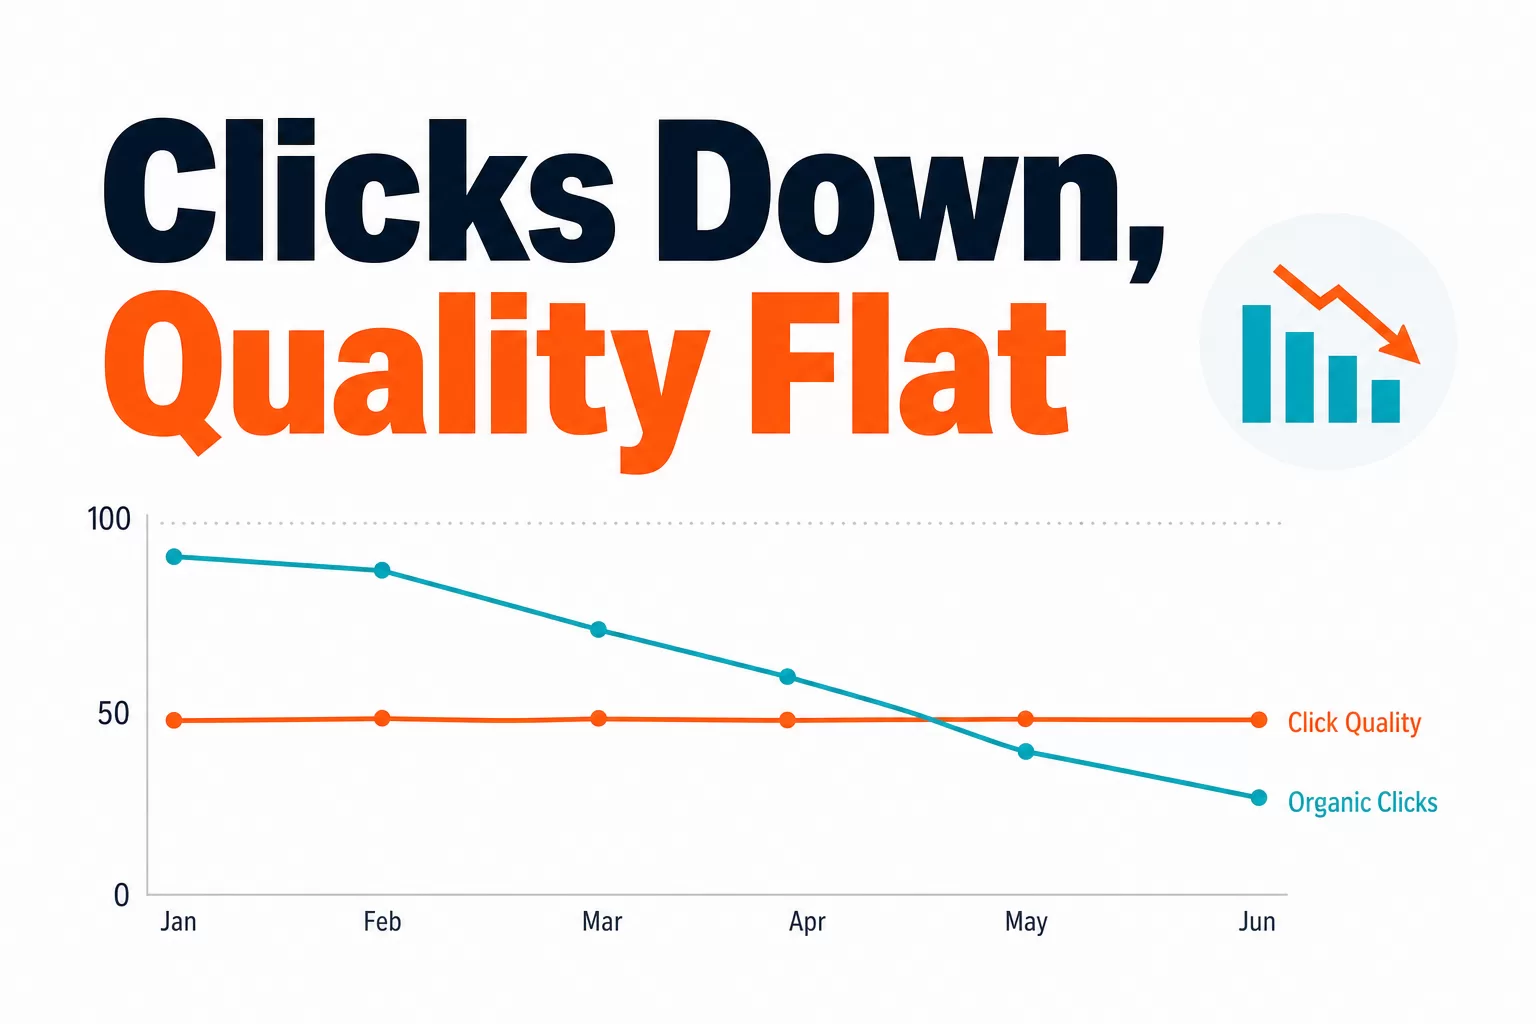
It also helps to define what success means before testing. In Discover, a headline format may increase surfacing frequency without improving downstream click behavior. That is not a contradiction; it is a reminder that visibility and engagement are different layers of performance.
For editorial teams, the most useful question is often whether a format is aligned with the story’s intent. A quote-led headline may work well for a reaction piece or interview. A declarative headline may be stronger for a utility article or breaking-news update. A question may be appropriate when the story is exploratory or audience-driven. The point is not to force one format everywhere.
Instead, build a headline taxonomy that reflects your own publishing model:
- Statement for direct, factual framing
- Quote-led for personality, reaction, and voice-heavy stories
- Question for curiosity-driven or problem-solving content
- Hybrid formats for cases where the story needs both clarity and tension
Then compare those formats inside your own dataset over time. If a format consistently wins within your site after controlling for section and topic, that is a real editorial signal. If it only wins in pooled market data, treat it as a hypothesis, not a rule.
That is the difference between headline optimization and headline folklore.
How to test headline formats correctly
A defensible Discover headline test should look more like an editorial experiment than a style preference debate. The goal is to reduce confounding variables as much as possible.
Use this workflow:
- Set a baseline using at least several months of your own Discover visibility data.
- Group headlines by format using a consistent taxonomy.
- Segment by publisher or site section if you manage multiple brands or verticals.
- Control for topic class so interviews are not compared with explainers or breaking news.
- Track both mean and median outcomes to avoid being misled by a few extreme performers.
- Review the result by surface so Discover behavior is not blended with search or social performance.
If you have enough volume, test headline changes in matched pairs: same topic, similar publication window, same section, different format. That will never be perfect, but it is far more informative than comparing all quote headlines against all statement headlines across the entire site.
Bottom line: The right unit of analysis is not the headline in isolation. It is the headline inside a publisher, inside a section, inside a topic, on a specific surface.
That is why headline optimization in Google Discover is not a shortcut problem. It is a measurement problem. The teams that win are the ones that stop asking for universal rules and start building publisher-specific evidence.
When you approach Discover this way, headline formats become what they really are: one signal among many, not a magic lever.